

Server logs are essential for system administrators and IT professionals. These records show when and how servers and applications operate, document errors, and capture other important events. Effective server log analysis plays a central role in detecting security issues, improving performance, and accelerating troubleshooting. This article explains how to analyze server logs in a clear, practical way, offering steps, tools, and best practices to help you get reliable insights from your logs.
What Are Server Logs?
Server logs, also called log files, are structured or semi-structured files that record a server’s activities over time. They provide details about requests, user sessions, application errors, system events, and other operational data. Properly maintained log files let administrators monitor server health, investigate incidents, and meet auditing and compliance requirements.
Types of Server Logs
Server logs commonly fall into several categories, each serving a distinct purpose:
1. Access Logs: Record requests to the server, including source IPs, requested resources, response status codes, and timestamps. These logs are useful for usage analysis and detecting anomalous access patterns.
2. Error Logs: Capture application and server-side errors, stack traces, warnings, and failure messages that help diagnose faults and bugs.
3. Event Logs: Track system events such as service start/stop, configuration changes, authentication events, and other operational actions.
Other specialized logs may include database logs, firewall logs, container logs, and application-specific logs. Each type contributes to a complete picture of system behavior when correlated.
Why Log Analysis Matters
Analyzing server logs is important for several reasons:
- Security: Identify intrusion attempts, suspicious access, brute-force activity, and indicators of compromise.
- Performance Monitoring: Track response times, bottlenecks, resource usage, and trends that affect capacity planning.
- Troubleshooting: Pinpoint root causes of errors and outages by following relevant entries and timestamps.
- Compliance and Auditing: Maintain records required by regulatory standards and prove that controls are operating as intended.
Steps to Analyze Server Logs
A systematic approach makes log analysis efficient and repeatable. Typical steps include:
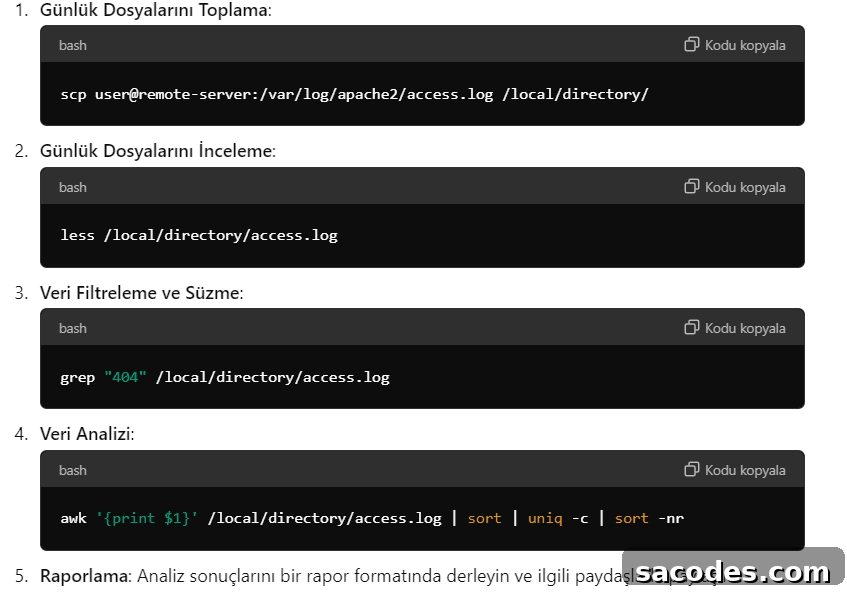
1. Collect Logs: Centralize logs from multiple servers and services into a single, searchable store. Collection can be manual for small environments or automated with agents and pipelines for larger infrastructures.
2. Inspect and Parse: Use text editors or parsing tools to interpret raw log formats (for example, the Common Log Format for web servers). Parsing converts unstructured text into fields that can be queried and visualized.
3. Filter and Enrich: Remove noise and irrelevant entries, normalize timestamps, and enrich records with context such as hostname, service name, or geo-IP data.
4. Analyze: Search for error patterns, correlate events across systems, detect anomalies, and compute metrics such as error rates or latency distributions.
5. Report and Alert: Create dashboards and automated alerts for critical conditions. Share summarized reports with stakeholders and maintain audit trails for investigations.
Tools and Techniques
There are a variety of tools and techniques to support log management and analysis:
- ELK Stack (Elasticsearch, Logstash, Kibana): A popular open-source stack for collecting, indexing, and visualizing log data at scale.
- Splunk: A commercial solution for searching, monitoring, and analyzing machine data with strong alerting and reporting features.
- Graylog: An open-source centralized log management platform focused on ease of use and scalable processing.
- GoAccess: A fast command-line tool for analyzing web server access logs interactively.
- AIDE (Advanced Intrusion Detection Environment): Useful for file integrity monitoring and detecting unexpected changes that may indicate intrusion.
Choosing tools depends on scale, budget, compliance needs, and integration requirements. Many organizations combine several tools to cover collection, storage, analysis, and alerting.
Example: Analyzing Apache Access Logs
For example, when examining Apache access logs you typically parse entries into fields like client IP, timestamp, request method, URL, HTTP status, and response size. With this data you can identify slow endpoints, recurring 4xx/5xx errors, or spikes in traffic from individual IPs that may indicate scanning or abuse.
Best Practices
- Regular Review: Schedule routine log reviews and periodic audits to detect problems early.
- Automate: Automate collection, parsing, alerting, and archival to reduce manual effort and ensure consistency.
- Secure Storage: Protect logs from tampering and restrict access to authorized personnel only.
- Retention Policies: Define how long logs are retained based on operational needs and compliance obligations, and implement secure deletion when appropriate.
- Privacy and Masking: Avoid storing sensitive personal data in logs, or apply masking/anonymization when required to meet privacy rules.
- Training: Ensure administrators and analysts are familiar with logging formats, query languages, and the tools in use.
Server log analysis is a foundational activity for secure, reliable, and efficient system operations. When you centralize logs, apply consistent parsing and enrichment, and use the right toolset to analyze and alert, you gain faster root-cause detection, better security visibility, and more effective capacity planning. Incorporate these practices into your operational routines to turn raw log data into actionable intelligence.